
Cost of debt shock cascades down market, rippling through PE deals over time, from largest to smallest.
Executive Summary
- • PE firms have collectively decelerated growth, but still expansionary (not a contraction).
- • Investment-to-exit ratios have converged across all deal sizes.
- • The PE investment slowdown cascaded down market, from the largest deals to the smallest.
- • LP pressure for distributions is pulling exits forward.
- • The market hasn’t yet cleared the 2021 investment surge.
The Study
Periodically, we look at the ratio of private equity platform investments to exits to gauge how the market is digesting macroeconomic pressure. The 2026 data tells a more precise story than “the PE market slowed down”. It shows a single shock working its way through the market at the speed of each deal-size tier’s financing channel.
The Data
We examined PE platform investment and exit data from 2017 through 2026 YTD across four deal-size categories:
- • Small ($0 – $50M)
- • Mid ($50M – $250M)
- • Large ($250M – $500M)
- • Mega ($500M+)
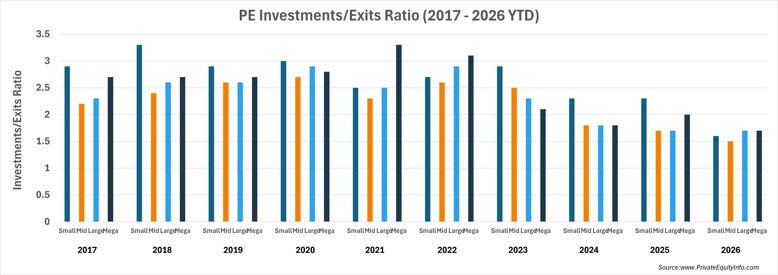
Investment-to-exit ratios have now converged to decade lows across every deal size category (1.5x - 1.7x, down from a historical range of 2.3x - 3.3x).
That convergence itself is new. For most of the past decade, PE firms working on Small and Mega sized deals carried a meaningfully higher investment-to-exit ratio of ~3.0. Today, all four deal size ranges sit around 1.6x investments-to-exits.
What the Ratio Measures
For context, the private equity industry is growing in aggregate when the ratio of investments-to-exits is greater than 1.0x and contracting when the ratio is less than 1.0x. For the last 20 years, investments have substantially outpaced exits as the private industry has expanded, often at 2.5x – 3.3x investments for every exit.
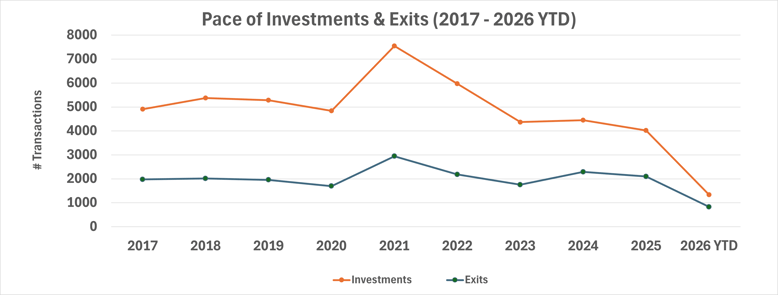
The investment-to-exit ratio dropping to ~1.6 across all deal size ranges captures the deceleration of an era of PE expansion, not a contraction. It is essentially a measure of the gap between the two lines shown below (total PE investments and PE exits each year).
A Financing Cascade, not a Collapse
The more interesting finding is when each size category’s ratio broke down.
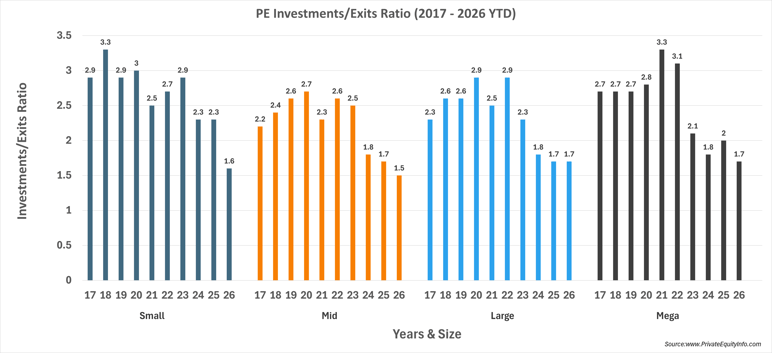
- • Mega dropped first: 2022 - 2023 (3.3x → 2.1x)
- • Large followed: 2022 - 2024 (2.9x → 1.8x)
- • Mid came next: 2023 - 2024 (2.5x → 1.8x)
- • Small was last: 2025 - 2026 (2.3x → 1.6x)
That’s not four unrelated slowdowns. It’s one shock, the 2022 rate-hiking cycle, propagating down the deal-size spectrum at roughly a one-year lag per step, arriving last at the segment furthest from institutional capital markets.
The mechanism is the financing structure. Mega and Large deals draw on syndicated leveraged loan and high-yield markets, which reprice to rate and spread moves almost immediately. Hence, Mega’s ratio breaking within a year of the hiking cycle starting. Mid deals sit in a hybrid zone, more reliant on direct/private lending, which adjusts on a longer lag. Small deals run largely on regional bank commercial and industrial lending, SBA-type products, and seller financing. That structural lag is a plausible explanation for why Small deals held an elevated expansion through 2023–2025 before finally dropping to 1.6x in 2026, roughly three years behind Mega.
There’s a plausible second-order effect compounding this: as Mega and Large sponsors found top-end deals harder to underwrite and exit in 2022–2023, capital likely rotated down-market chasing lower entry multiples. This served to temporarily prop up Small and Mid activity, even as the top of the market slowed.
In late 2025, we published:
“the cost of debt is not the sole driver of private-equity activity, but it is the single clearest, most consistent observable proxy for the PE cycle.” Source.
The most recent investment-to-exit ratio data presented here reinforces that thesis. The net effect looks like a structural lengthening of median hold periods, which we have also seen in the data.
LPs are Pulling Exits Forward
The financing-cascade story explains why new investment pace fell in stages. It doesn’t fully explain the exit side. That’s where LP pressure comes in. Distributions to paid-in capital has increasingly displaced IRR as a key metric for LPs.
Put together, this suggests two compounding forces for the investment-to-exit ratio:
- 1. Debt financing tightening – lowering the numerator
- 2. LP-driven exit pressure – increasing the denominator.
2021 Investment Bulge Clearing Schedule
There’s a third layer as well, not financing conditions or LP behavior, but simple portfolio arithmetic. 2021 was a historic outlier for platform investment, running roughly 50% above the surrounding years. On any normal hold-period assumption, that oversized vintage should eventually show up as a bulge in exit volume.
The median hold period for 2026 exits currently stands at 6.2 years. Run that backward, and the companies exiting in 2026 were invested around 2019–2020, at peak pre-Covid valuations and well before the 2021 surge. Run it forward instead, and the 2021 vintage (also at peak valuations) might not clear until 2027 (on a median basis). In other words:
The market likely hasn’t worked through the 2021 vintage bulge… although LP pressure may be accelerating those exits.
Conclusion
- • The debt financing cascade and LP-pressure dynamics explain the PE investment deceleration we’re seeing today.
- • If the cascade logic holds, Small deals were simply the last to feel the financing shock, not the start of a new leg down.
- • Watch for a discernible pickup in exit volume in late 2026 and into 2027 as the largest investment vintage on record begins to come to market.
Targeted M&A data. All signal, no noise.
This report is built from Private Equity Info's data on thousands of firms and funds. Explore the database →