
Conventional wisdom suggests that the pace of private equity investments should ultimately drive exits, delayed by the median holding period for portfolio companies, which is currently close to six years. More investments today should, in theory, translate into more exits five to six years later. This is the Hold Period Cycle.
Simultaneously, exits fuel future investments because private equity capital flows in a loop: capital commitments, deployments, realizations, distributions, and recommitments. The back part of this capital cycle (realizations to recommitments) introduces a lag between exits and new capital formation. One might therefore expect elevated exit volumes to precede new investment surges. This is the Capital Cycle.
In this framing, investments drive exits and exits drive investments based on two different cycles, each reinforcing the other.
Seems reasonable. Yet the empirical data tell a different story, one in which macroeconomic conditions, especially the cost of debt, exert far more influence on private equity deal flow than Holding Periods or Capital Cycle mechanics.
By examining 25 years of private equity activity alongside the prevailing cost of high-yield corporate debt, we find that the private equity market is driven by two distinct engines. One engine drives both platform investments and exits and a second engine drives add-on investments.
Investments and exits in sync
The chart below shows 25 years of platform acquisitions and exits from the Private Equity Info database, with 88,030 acquisitions and 35,507 exits.
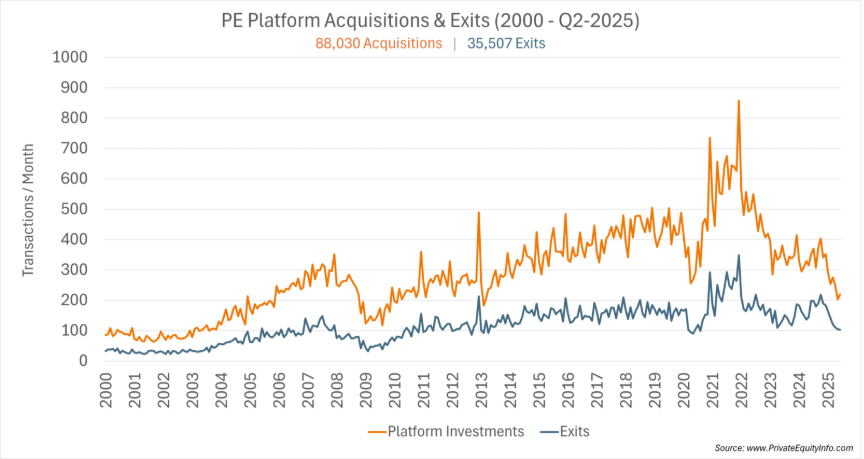
The expectation from Hold Period logic would be that exits should lag investments by five to six years while the expectation from the Capital Cycle thesis would suggest investments should lag exits by 1 to 2 years. Yet the data show that platform investments and exits move in near-perfect synchrony.
Peaks align. Troughs align. The 2008 recession, the post-2008 recovery, the Covid dip followed by the 2021 surge, and the most recent contraction all show platforms and exits moving together rather than sequentially.
The intuitive interpretation is that these transaction types share common external drivers that overshadow the more gradual mechanics of portfolio aging or private equity capital cycles.
This observation does not diminish the importance of holding-period analysis for managing a fund. The median holding period remains central to modeling duration, pacing, and exit planning. But at the aggregate industry level, holding periods appear to react to larger market cycles, rather than drive them.
Macroeconomic conditions and the cost of debt
The graph below overlays the same transaction data with Federal Reserve high-yield corporate bond yields (blue line), a reasonable proxy for cost of debt trends in leveraged buyouts.

The result is striking.
Periods of low borrowing costs (2004-2007, 2012–2019, and 2021) correspond to broad expansions in both platform investments and exits.
Periods of elevated yields (2008–2009 and 2022–2024), line up with sharp contractions in PE deals. The directional alignment is consistent across multiple economic cycles.
Because every M&A transaction has both a buy-side and a sell-side, credit conditions influence the entire system at once.
- Buyers face stricter leverage, lower underwriting capacity, and compressed valuations.
- Sellers delay exits when valuations weaken or financing markets become unreliable.
This explains why platform investments and exits tend to move together rather than follow offsetting cycles.
Is the cost of debt causal or merely correlated?
This question deserves nuance. Our analysis demonstrates that the cost of debt is not the sole driver of private-equity activity, but it is the single clearest, most consistent observable proxy for the PE cycle.
The case for causation:
- Sequence matters: yield spikes often slightly precede drops in platform and exit activity.
- Deal math is mechanical: higher yields reduce valuations and deal feasibility.
- Credit standards constrict both leverage and certainty of execution.
- Cycle repetition: the same pattern appears across every major cycle.
- Rate of change: rapid changes in the cost-of-debt correlate to rapid changes for PE investments/exits.
In this view, the cost of debt is not just correlated; it is a primary transmission channel that directly influences deal volume.
The case against strict causation:
- Macro shocks affect both yields and deal sentiment simultaneously. Recessions, volatility, and declining corporate earnings reduce transaction appetite independently of financing costs as debt yield is an overall proxy for economic uncertainty.
- Equity-market conditions and strategic buyer activity also shape deal timing.
- LP constraints are not determined by yields.
- Some portion of the observed relationship may reflect shared underlying risk sentiment, not unilateral causation.
What about Add-ons?
The companion chart showing Add-on activity (orange line) from 2015 – 2025 overlaid with the same high yield corporate debt curve (blue line), reveals a different story.
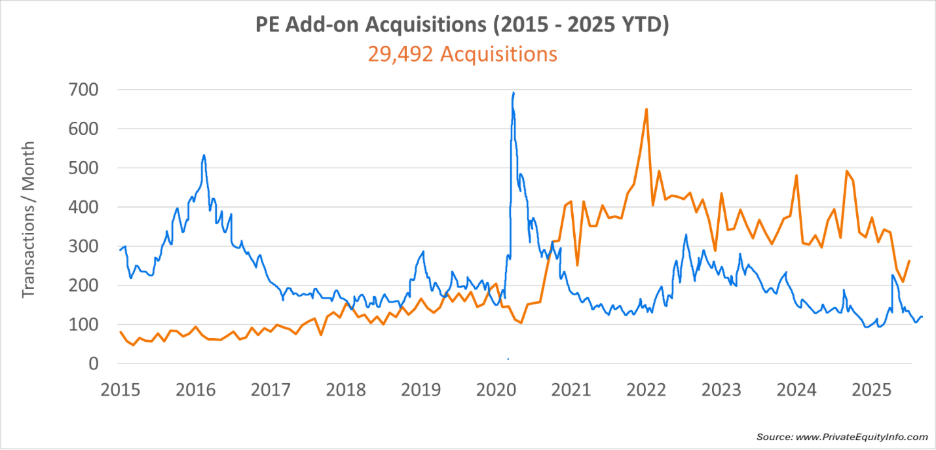
As demonstrated in the chart, add-ons:
- Do not track cost of debt closely
- Remain comparatively stable even when platforms collapse
- Decline in crises, but not in proportion to yield changes
Add-ons operate under fundamentally different dynamics. Why?
- They require smaller checks, often funded through revolvers or cash.
- They are more tied to portfolio strategy, rather than macro conditions.
- They remain accretive through multiple expansion, even at higher financing costs.
- They depend on portfolio maturity, sector fragmentation, and GP focus.
Add-ons follow the operating rhythm of the portfolio, not the broader credit environment. This bifurcation explains why Add-ons can rise in years when platforms and exits are compressed.
Implications for the upcoming cycle
Private equity deal activity is driven by two distinct engines:
- A Leveraged Financial Engine that drives platform acquisitions and exits, responding directly to credit conditions.
- A Strategic Operating Engine that drives add-on acquisitions to advance company-building initiatives, regardless of the macro backdrop.
Given the U.S. debt-to-GDP ratio and the long-term political and economic incentives toward monetary easing, it is plausible that borrowing costs will trend downward over the medium term.
No forecast is certain, but if monetary policy loosens and the cost of debt declines, a reasonable thesis for the next few years, based on historical patterns, is that PE platform investment & exit volume should increase accordingly.
Meanwhile, add-ons will likely continue at a steadier pace, governed more by sector fragmentation, portfolio maturity, and roll-up strategy than by financing costs.
That is, we may see a season where platforms and exits rebound while add-ons continue steadily, but unevenly across sectors.


